- 2013
- 12/04
商用利用が可能な、グラフを描画するjQueryプラグイン6選
グラフを表示させないといけないという案件が出てきたので、グラフを描画するjQueryプラグインについて調べてみました。
グラフ描画用のjQueryプラグインはたくさん見つかりましたが、グラフの描画は難易度の高い処理のためか商用利用は有償というライセンスが多いようでした。
しかし商用利用可能なオープンソースライセンス(BSD、MITライセンスなど)のプラグインでも、充分に高機能なものもありましたので、私個人がいいと思ったプラグインを6つ紹介します。
・商用利用可能なライセンス
・1つのプラグインでいくつかの種類のグラフが表示できる
という2点を満たすものを選んでいます。
ADs
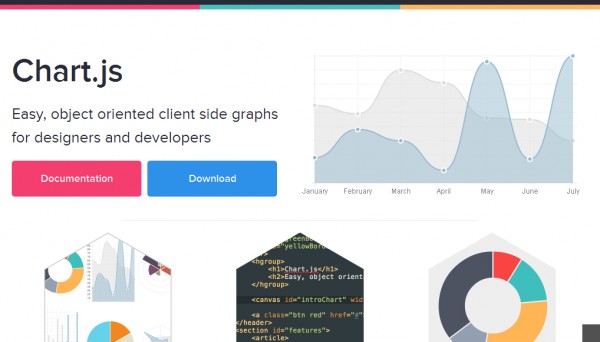
Chart.js
MITライセンス。
線グラフ、棒グラフ、レーダーチャート、鶏頭図(Polar area chart)、円グラフ、ドーナツグラフを書くことができます。
サンプルコード
|
1 |
<canvas id="myChart" width="400" height="400"></canvas> |
|
1 2 3 4 5 6 7 8 9 10 11 12 13 14 15 16 17 18 19 20 21 |
var ctx = $("#myChart").get(0).getContext("2d"); var data = { labels : ["January","February","March","April","May","June","July"], datasets : [ { fillColor : "rgba(220,220,220,0.5)", strokeColor : "rgba(220,220,220,1)", pointColor : "rgba(220,220,220,1)", pointStrokeColor : "#fff", data : [65,59,90,81,56,55,40] }, { fillColor : "rgba(151,187,205,0.5)", strokeColor : "rgba(151,187,205,1)", pointColor : "rgba(151,187,205,1)", pointStrokeColor : "#fff", data : [28,48,40,19,96,27,100] } ] } var myNewChart = new Chart(ctx).Line(data,options); |
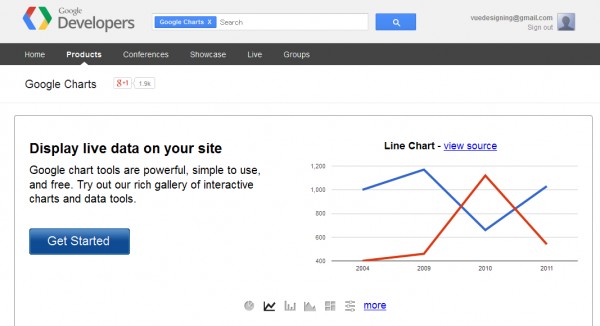
Google Charts
Google製。
棒グラフ、線グラフ、円グラフから地図を塗り分けた分布図まで作成できる。
サンプルコード
|
1 2 3 |
<script type="text/javascript" src="https://www.google.com/jsapi"></script> ~中略~ <div id="piechart" style="width: 900px; height: 500px;"></div> |
|
1 2 3 4 5 6 7 8 9 10 11 12 13 14 15 16 17 18 19 |
google.load("visualization", "1", {packages:["corechart"]}); google.setOnLoadCallback(drawChart); function drawChart() { var data = google.visualization.arrayToDataTable([ ['Task', 'Hours per Day'], ['Work', 11], ['Eat', 2], ['Commute', 2], ['Watch TV', 2], ['Sleep', 7] ]); var options = { title: 'My Daily Activities' }; var chart = new google.visualization.PieChart(document.getElementById('piechart')); chart.draw(data, options); } |
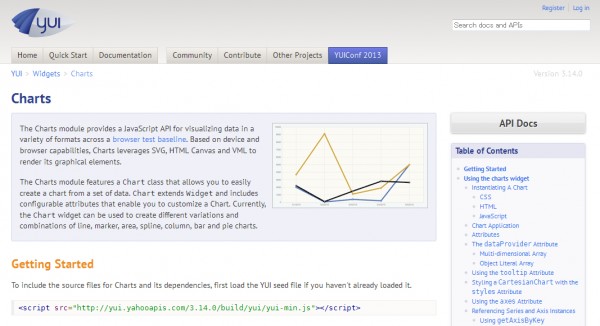
YUI Charts
YUI(Yahoo!UserInterface)のウィジェットとして提供。BSDライセンス。
線グラフ、棒グラフ、円グラフなどスタンダードなものが一通りできる。
サンプルコード
|
1 2 3 |
<script src="https://yui.yahooapis.com/3.14.0/build/yui/yui-min.js"></script> ~中略~ <div id="mychart"></div> |
|
1 2 3 4 5 6 7 8 9 10 11 12 13 14 15 16 17 18 |
YUI().use('charts', function (Y) { // Data for the chart var myDataValues = [ {category:"5/1/2010", values:2000}, {category:"5/2/2010", values:50}, {category:"5/3/2010", values:400}, {category:"5/4/2010", values:200}, {category:"5/5/2010", values:5000} ]; // Instantiate and render the chart var mychart = new Y.Chart({ dataProvider: myDataValues, render: "#mychart" }); }); |
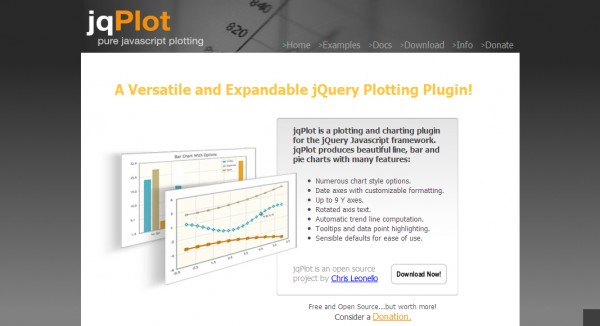
jQPlot
線グラフ、棒グラフ、円グラフなど。GPL&MITライセンス。
ドラッグして数値を変えたりできる。
サンプルコード
|
1 2 3 4 |
<script language="javascript" type="text/javascript" src="jquery.jqplot.min.js"></script> <link rel="stylesheet" type="text/css" href="jquery.jqplot.css" /> ~中略~ <div id="chartdiv" style="height:400px;width:300px; "></div> |
|
1 2 3 4 5 |
$.jqplot('chartdiv', [[[1, 2],[3,5.12],[5,13.1],[7,33.6],[9,85.9],[11,219.9]]], { title:'Exponential Line', axes:{yaxis:{min:-10, max:240}}, series:[{color:'#5FAB78'}] }); |
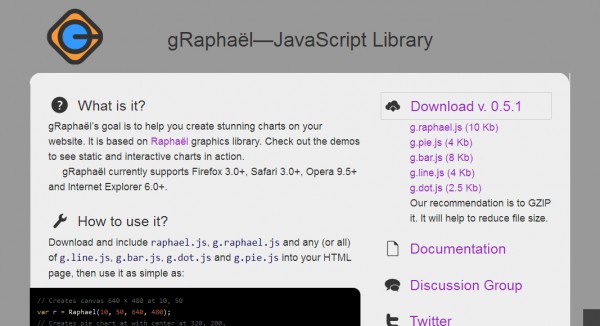
gRaphaël
Raphaëlを使ったグラフ用ライブラリ。MITライセンス。
円グラフ、棒グラフ、折れ線グラフ、ドットが分布したようなグラフが作成可能。各グラフごとにJSファイルが分割されているので軽量化できる。
サンプルコード
|
1 2 3 4 5 |
<script src="//raphaeljs.com/raphael.js"></script> <script src="g.raphael.js"></script> <script src="g.pie.js"></script> ~中略~ <div id="holder"></div> |
|
1 2 3 4 5 6 7 8 9 10 11 12 13 14 15 16 17 18 19 20 21 22 23 |
window.onload = function () { var r = Raphael("holder"), pie = r.piechart(320, 240, 100, [55, 20, 13, 32, 5, 1, 2, 10], { legend: ["%%.%% - Enterprise Users", "IE Users"], legendpos: "west", href: ["http://raphaeljs.com", "http://g.raphaeljs.com"]}); r.text(320, 100, "Interactive Pie Chart").attr({ font: "20px sans-serif" }); pie.hover(function () { this.sector.stop(); this.sector.scale(1.1, 1.1, this.cx, this.cy); if (this.label) { this.label[0].stop(); this.label[0].attr({ r: 7.5 }); this.label[1].attr({ "font-weight": 800 }); } }, function () { this.sector.animate({ transform: 's1 1 ' + this.cx + ' ' + this.cy }, 500, "bounce"); if (this.label) { this.label[0].animate({ r: 5 }, 500, "bounce"); this.label[1].attr({ "font-weight": 400 }); } }); }; |
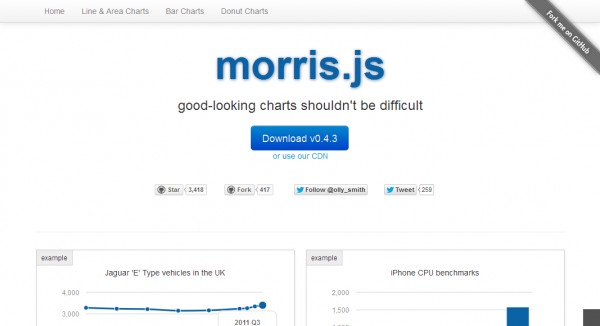
morris.js
「good-looking charts」とのこと。叶姉妹を思い出す。。。BSDライセンス。
線グラフ、棒グラフ、積み上げグラフ、ドーナツチャートが作成可能。jQueryのほかRaphaëlが必要です。
サンプルコード
|
1 2 3 4 5 6 |
<link rel="stylesheet" href="http://cdn.oesmith.co.uk/morris-0.4.3.min.css"> <script src="//ajax.googleapis.com/ajax/libs/jquery/1.9.0/jquery.min.js"></script> <script src="//cdnjs.cloudflare.com/ajax/libs/raphael/2.1.0/raphael-min.js"></script> <script src="https://cdn.oesmith.co.uk/morris-0.4.3.min.js"></script> ~中略~ <div id="myfirstchart" style="height: 250px;"></div> |
|
1 2 3 4 5 6 7 8 9 10 11 12 13 14 15 16 17 18 19 20 |
new Morris.Line({ // ID of the element in which to draw the chart. element: 'myfirstchart', // Chart data records -- each entry in this array corresponds to a point on // the chart. data: [ { year: '2008', value: 20 }, { year: '2009', value: 10 }, { year: '2010', value: 5 }, { year: '2011', value: 5 }, { year: '2012', value: 20 } ], // The name of the data record attribute that contains x-values. xkey: 'year', // A list of names of data record attributes that contain y-values. ykeys: ['value'], // Labels for the ykeys -- will be displayed when you hover over the // chart. labels: ['Value'] }); |
上記の中でChart.jsがシンプルで使いやすそうかな、と思いました。実装した際はChart.jsについて掘り下げた記事を書いてみたいと思います。
ADs
Related Articles関連記事
Comments
I see you don’t use the power of social websites like twitter
and facebook on your website. You can get huge traffic from social sites on autopilot
using one useful app, for more info search in google for:
Alufi’s Social Automation
- Colin
- 2015年3月20日 10:47 PM
